Visualizing supplier emissions for informed decisions
Background
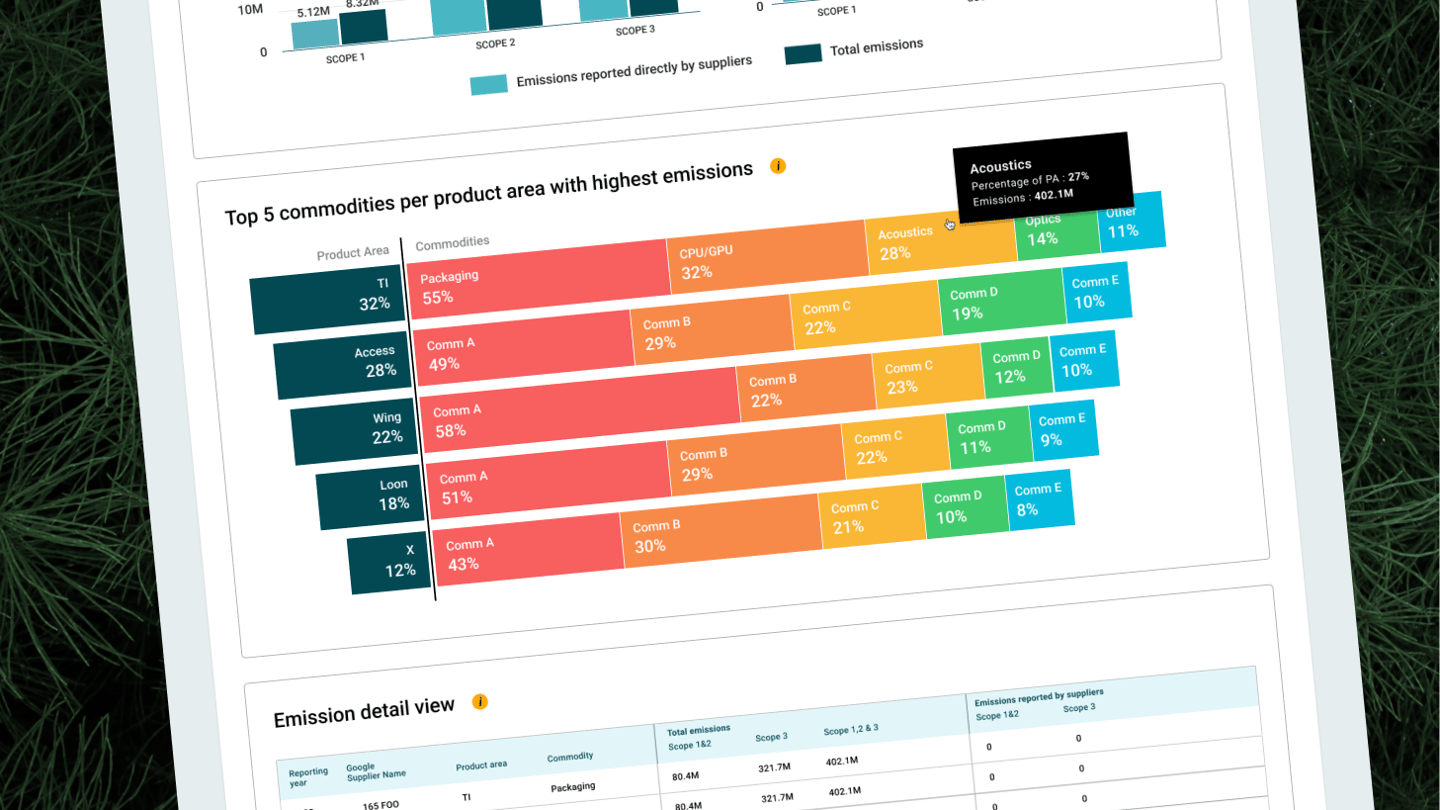
Google is responsible for keeping track of the amount of emissions their suppliers emit per quarter. What the suppliers emit becomes part of the total emissions that Google must report. In order to identify what their suppliers are doing, Google needs to identify what kind of emission and what practices they are doing to help reduce emissions.
Services
Discovery
Product Definition
Brainstorm & Concept Development
Design Direction
UX Design
Visual Design
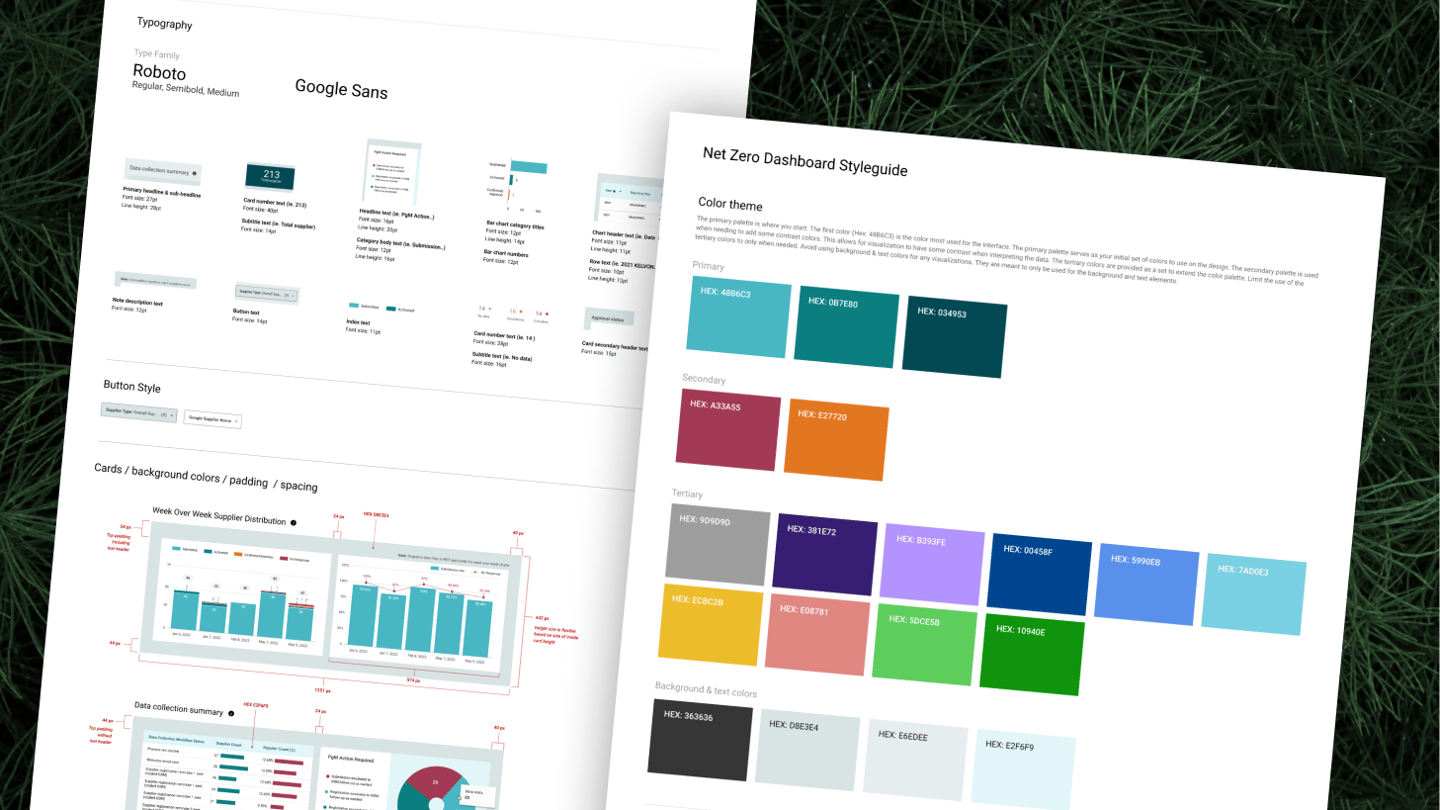
Styleguide
Client Relationship
Team Management
Concept and Design
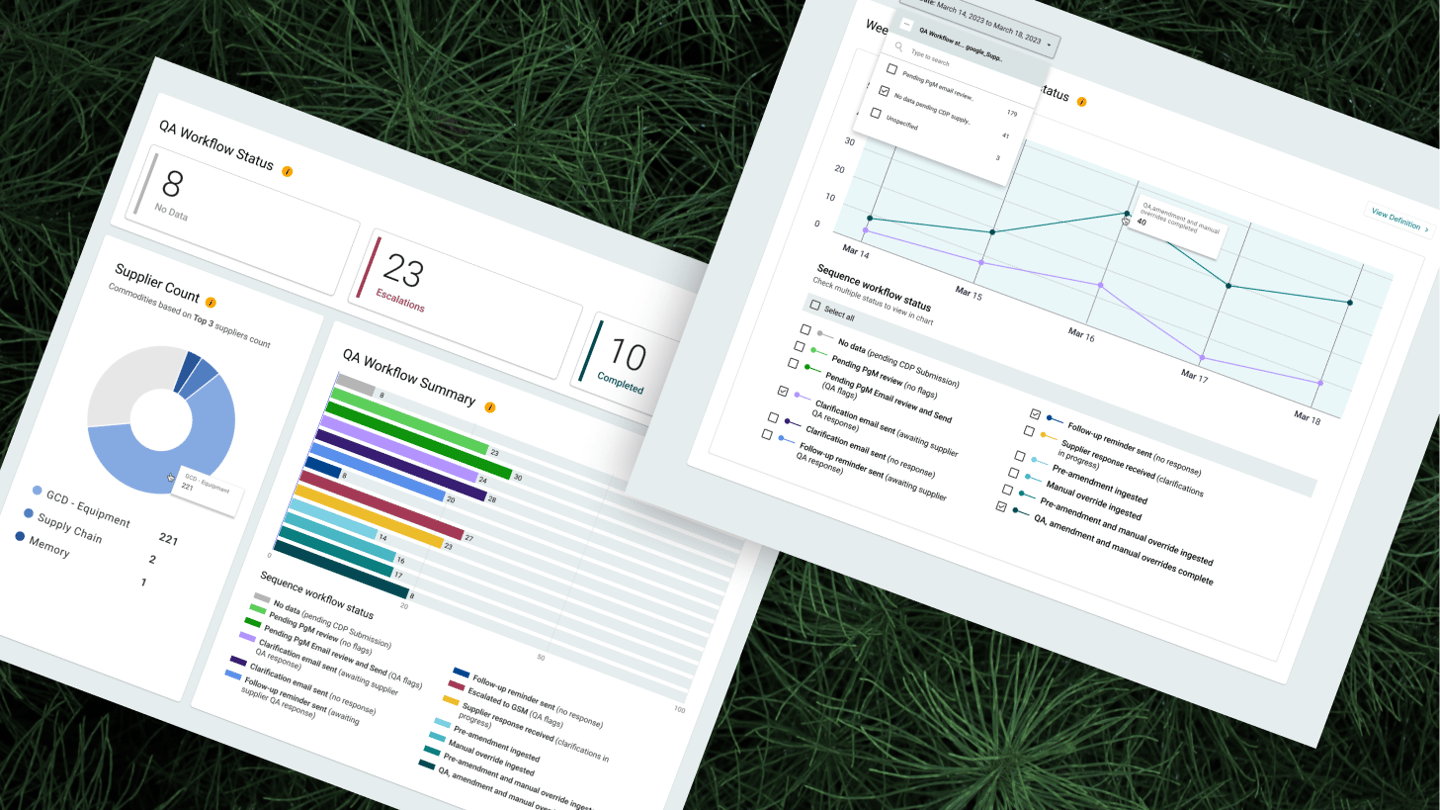
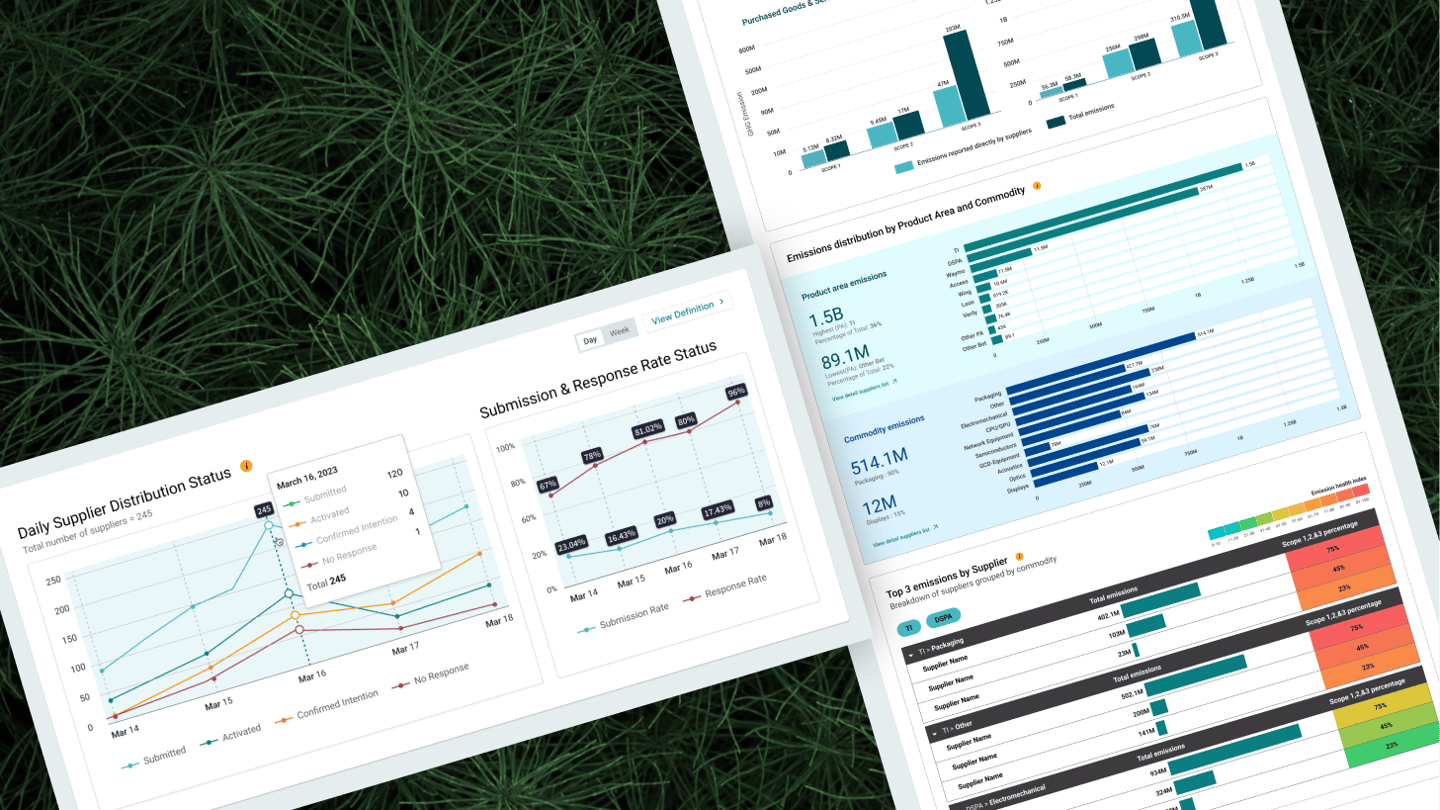
Google had many requirements for this design. I spent time understanding all the requirements including understanding what stories need to be told for the visualizations to make sense. One of the key challenges is this needs to be built on a proprietary platform. Each design visualization encompasses the detail that needs to be accounted for. The visualizations have to tell the story at a higher level for leadership and showcase details for those working directly with the suppliers.
Results and Impact
When we started the project, Google had some doubts we can improve on what they already started. Within two weeks, they shifted their mentality and were amazed at the outcome given this was limited by a proprietary platform. What originally was scheduled for a month-long project turned into 5 months of collaboration and partnership.